GMAT Data Insights Practice Questions with Answers & Detailed Explanations
This practice set has been created specifically to help you prepare for the GMAT Data Insights section. The questions are original and designed to reflect the style, reasoning, and problem-solving skills tested on the current GMAT. These questions are made for practice and learning purposes only and are not taken from, adapted from any official GMAT source.
You'll find balanced practice across all five Data Insights question types: Data Sufficiency, Multi-Source Reasoning, Table Analysis, Graphics Interpretation, and Two-Part Analysis. The questions draw on a wide range of quantitative concepts, including arithmetic, algebra, ratios, percentages, rates, statistics, probability, inequalities, weighted averages, and business data interpretation.
Coverage Map
| Question Type | Questions in this set | Main skills practiced |
|---|---|---|
| Data Sufficiency | 1-8 | Data adequacy, algebra, number properties, inequalities, probability |
| Table Analysis | 9-16 | Sorting, ratios, percentages, rates, totals, business metrics |
| Graphics Interpretation | 17-24 | Charts, trends, percent change, indexed data, break-even analysis |
| Two-Part Analysis | 25-32 | Linked decisions, equations, mixtures, rates, probability, inequalities |
| Multi-Source Reasoning | 33-40 | Using multiple sources, criteria testing, consistency, business calculations |
Practice Questions with Detailed Solutions
Data Sufficiency
Question 1 - Percent change and reverse calculation
A product was sold at a discount. What was the original list price of the product?
(1) The selling price after a 20% discount was $96.
(2) The discount was $24.
Answer: D
Explanation:
Statement (1): If the item sold for 80% of the original price, then 0.80 × original = 96, so the original price is uniquely determined as 120. Sufficient. Statement (2): If the discount was 20% of the original price and that discount was $24, then 0.20 × original = 24, so the original price is uniquely determined as 120. Sufficient. Each statement alone gives one exact original price.
Question 2 - Weighted average
A class has boys and girls. What is the average score of the entire class?
(1) The boys averaged 78 and the girls averaged 84.
(2) There are 12 boys and 18 girls in the class.
Answer: C
Explanation:
Statement (1) gives the two group averages but not the group sizes, so the overall weighted average cannot be found. Statement (2) gives the group sizes but not the scores. Together, use weighted average: (12×78 + 18×84)⁄(12+18), which gives one value. Thus together sufficient, neither alone sufficient.
Question 3 - Number properties
Is integer n divisible by 6?
(1) n is divisible by 3.
(2) n is even.
Answer: C
Explanation:
To be divisible by 6, an integer must be divisible by both 2 and 3. Statement (1) gives divisibility by 3 but not by 2, so n could be 9 or 12. Not sufficient. Statement (2) gives evenness but not divisibility by 3, so n could be 8 or 12. Not sufficient. Together, n is even and divisible by 3, so n is divisible by 6.
Question 4 - Linear equation
What is the value of x + y?
(1) 2x + 2y = 18.
(2) x - y = 5.
Answer: A
Explanation:
Statement (1) simplifies to x + y = 9, exactly what is asked. Sufficient. Statement (2) gives only the difference, not the sum. For example, x=5,y=0 gives sum 5, while x=6,y=1 gives sum 7. Not sufficient.
Question 5 - Rates and work
Machine A and Machine B together produce 600 parts. How many parts did Machine A produce?
(1) Machine A produced 40% more parts than Machine B.
(2) Machine B produced 250 parts.
Answer: D
Explanation:
Statement (1): Let B=b, then A=1.4b and A+B=600. This gives one value for A. Sufficient. Statement (2): Since total production is 600 and B=250, A=350. Sufficient. Each statement alone gives a unique answer.
Question 6 - Median with a small set
The five numbers a, 7, 9, 12, and 15 are arranged in increasing order. What is the median?
(1) a < 7.
(2) a = 10.
Answer: A
Explanation:
The stem says the numbers are arranged in increasing order as written, so a is first and the middle number is 9. Statement (1) is consistent with that and confirms a is before 7, so the median is 9. Sufficient. Statement (2) conflicts with the order in the stem because if a=10, the list as written would not be increasing. On GMAT-style problems, statements should be considered with the stem; this inconsistency means the statement cannot produce a valid unique median under the given condition. Not sufficient.
Question 7 - Inequalities
Is x greater than 10?
(1) x > 8.
(2) x < 12.
Answer: E
Explanation:
Statement (1) allows x=9 and x=11, so the answer could be no or yes. Statement (2) allows x=9 and x=11, so the answer could be no or yes. Together, 8 < x < 12, and x could still be 9 or 11. The answer is not fixed.
Question 8 - Probability basics
A box contains only red and blue markers. If one marker is selected at random, what is the probability it is red?
(1) There are 18 markers in the box.
(2) The ratio of red markers to blue markers is 2 to 7.
Answer: B
Explanation:
Statement (1) gives the total but not how many are red. Not sufficient. Statement (2) gives the fraction red as 2⁄(2+7)=2⁄9, regardless of the total. Sufficient.
Table Analysis
Question 9 - Sortable table: sales productivity
The table shows monthly performance for five sales representatives.
| Rep | Leads | Sales | Revenue ($000) | Hours |
|---|---|---|---|---|
| Asha | 80 | 20 | 96 | 160 |
| Ben | 65 | 13 | 78 | 130 |
| Chen | 90 | 27 | 108 | 180 |
| Divya | 75 | 18 | 99 | 150 |
| Eli | 70 | 14 | 84 | 140 |
For each statement, determine whether it is True or False.
Answer: A) True, B) True, C) False
Explanation:
Conversion rates are Sales⁄Leads: Asha 25%, Ben 20%, Chen 30%, Divya 24%, and Eli 20%. Chen has the highest conversion rate and also the highest revenue, so statement 1 is True. Revenue per sale is Revenue⁄Sales: Asha $4,800, Ben $6,000, Chen $4,000, Divya $5,500, and Eli $6,000. Exactly Ben and Eli are at least $6,000 per sale, so statement 2 is True. Revenue per hour is Revenue⁄Hours: Asha, Ben, Chen, and Eli each generate $600 per hour, while Divya generates $660 per hour; therefore statement 3 is False.
Question 10 - Employee training hours
Use the table to evaluate training completion.
| Team | Employees | Avg Hours | Completed Module (%) | Cost per Employee ($) |
|---|---|---|---|---|
| Alpha | 24 | 11 | 75 | 420 |
| Beta | 30 | 9 | 80 | 360 |
| Gamma | 18 | 13 | 67 | 500 |
| Delta | 28 | 10 | 70 | 390 |
| Epsilon | 20 | 12 | 85 | 450 |
For each statement, determine whether it is True or False.
Answer: A) True, B) False, C) False
Explanation:
Completed counts: Alpha 18, Beta 24, Gamma about 12.06, Delta 19.6, Epsilon 17; Beta is greatest. Total cost equals employees times cost: Alpha 10,080; Beta 10,800; Gamma 9,000; Delta 10,920; Epsilon 9,000, so Gamma is not highest. Epsilon has the highest completion rate, but Gamma has the highest average hours, so the last statement is false.
Question 11 - Inventory turnover
The table shows inventory and sales for five stores.
| Store | Opening Inv. | Closing Inv. | COGS | Sales |
|---|---|---|---|---|
| P | 120 | 100 | 440 | 600 |
| Q | 90 | 110 | 500 | 690 |
| R | 150 | 130 | 560 | 760 |
| S | 80 | 120 | 480 | 640 |
| T | 100 | 100 | 450 | 585 |
For each statement, determine whether it is True or False.
Answer: A) True, B) False, C) True
Explanation:
Gross margin percentage = (Sales − COGS) ⁄ Sales. The percentages are P 26.7%, Q 27.5%, R 26.3%, S 25.0%, and T 23.1%, so statement 1 is True. Inventory turnover = COGS ⁄ average inventory. The turnovers are P 4.0, Q 5.0, R 4.0, S 4.8, and T 4.5, so Q, not S, has the highest turnover; statement 2 is False. Store T has opening inventory 100 and closing inventory 100, so statement 3 is True.
Question 12 - Subscription plan analysis
A streaming company tracks five plans.
| Plan | Monthly Price | Subscribers | Churn % | Support Tickets |
|---|---|---|---|---|
| Basic | 8 | 12000 | 6 | 420 |
| Plus | 12 | 9000 | 4 | 360 |
| Family | 18 | 6500 | 3 | 310 |
| Student | 6 | 7000 | 5 | 175 |
| Premium | 22 | 4000 | 2 | 220 |
For each statement, determine whether it is True or False.
Answer: A) False, B) True, C) True
Explanation:
Churned subscribers are Basic 720, Plus 360, Family 195, Student 350, and Premium 80. Premium has the lowest churn rate and also the lowest number of churned subscribers, so statement 1 is False. Monthly revenue is price times subscribers: Family $117,000 and Plus $108,000, so statement 2 is True. Support tickets per 1,000 subscribers are Basic 35, Plus 40, Family about 47.7, Student 25, and Premium 55, so statement 3 is True.
Question 13 - Profit by region
The table summarizes regional results.
| Region | Units Sold | Price per Unit | Variable Cost per Unit | Fixed Cost ($000) |
|---|---|---|---|---|
| North | 9000 | 32 | 18 | 60 |
| South | 7500 | 35 | 20 | 55 |
| East | 8200 | 30 | 17 | 50 |
| West | 6800 | 40 | 22 | 65 |
| Central | 7200 | 34 | 19 | 45 |
For each statement, determine whether it is True or False.
Answer: A) True, B) True, C) False
Explanation:
Contribution per unit: North 14, South 15, East 13, West 18, Central 15; West is highest. Total contribution: North 126k, South 112.5k, East 106.6k, West 122.4k, Central 108k; North is highest. Operating profit subtracts fixed cost: North 66k, South 57.5k, East 56.6k, West 57.4k, Central 63k; North is highest, not Central.
Question 14 - Order fulfillment
The table shows order data by warehouse.
| Warehouse | Orders | Late Orders | Returned Orders | Avg Ship Cost ($) |
|---|---|---|---|---|
| A | 1200 | 84 | 36 | 7.5 |
| B | 950 | 57 | 19 | 8.2 |
| C | 1100 | 66 | 44 | 7.1 |
| D | 800 | 48 | 16 | 9.0 |
| E | 1000 | 50 | 30 | 7.8 |
For each statement, determine whether it is True or False.
Answer: A) True, B) True, C) False
Explanation:
Late rates: A 7%, B 6%, C 6%, D 6%, E 5%; E is lowest. Return rates: A 3%, B 2%, C 4%, D 2%, E 3%; C is highest. Total shipping cost: A 1200×7.5=9000; B 7790; C 7810; D 7200; E 7800, so D is lowest, not A.
Question 15 - Market research survey
A survey reports preference by age group.
| Age Group | Respondents | Prefer Product X | Prefer Product Y | No Preference |
|---|---|---|---|---|
| 18-24 | 160 | 72 | 56 | 32 |
| 25-34 | 220 | 110 | 66 | 44 |
| 35-44 | 180 | 81 | 72 | 27 |
| 45-54 | 140 | 56 | 63 | 21 |
| 55+ | 100 | 35 | 45 | 20 |
For each statement, determine whether it is True or False.
Answer: A) True, B) False, C) False
Explanation:
Counts for X are highest for 25-34 at 110. Percentages for X: 45%, 50%, 45%, 40%, 35%; 25-34 is also highest. Product Y exceeds X in 45-54 and 55+, so it is not the only group. Total respondents = 800; Product X total = 354, not 400, so not exactly half.
Question 16 - Project portfolio
The table lists project budgets and returns.
| Project | Initial Cost ($000) | Expected Annual Cash Flow ($000) | Risk Score | Duration (years) |
|---|---|---|---|---|
| A | 300 | 95 | 3 | 4 |
| B | 450 | 120 | 2 | 5 |
| C | 250 | 80 | 4 | 3 |
| D | 500 | 160 | 5 | 4 |
| E | 350 | 100 | 3 | 5 |
For each statement, determine whether it is True or False.
Answer: A) True, B) True, C) True
Explanation:
Payback = initial cost ⁄ annual cash flow. A is about 3.16 years, B is 3.75 years, C is 3.125 years, D is 3.125 years, and E is 3.5 years. Since C is tied for the shortest payback period, statement 1 is True. Project B has the lowest risk score, so statement 2 is True. Total expected cash flow equals annual cash flow times duration: A 380, B 600, C 240, D 640, and E 500 thousand dollars; D is greatest, so statement 3 is True.
Graphics Interpretation
Question 17 - Line graph: margin trend
Refer to the line graph showing revenue and cost for Northstar Apps.
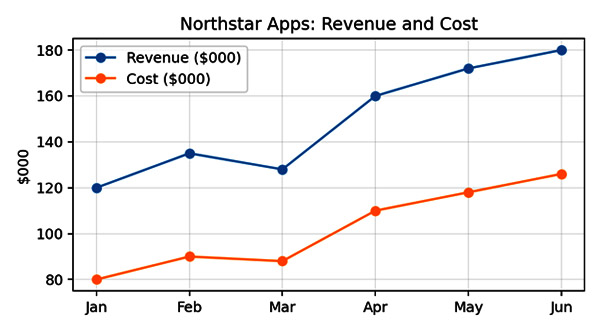
Complete the statements using the most accurate choices.
Answer: A) May and June; B) 50%
Explanation:
Profit is revenue minus cost. The monthly profits are 40, 45, 40, 50, 54, and 54 thousand dollars. May and June tie for greatest profit, so the most accurate answer is May and June. Revenue increased from 120 to 180, an increase of 60 on a base of 120, or 50%.
Question 18 - Scatter plot: demand relationship
Refer to the scatter plot of drink price and weekly units sold.
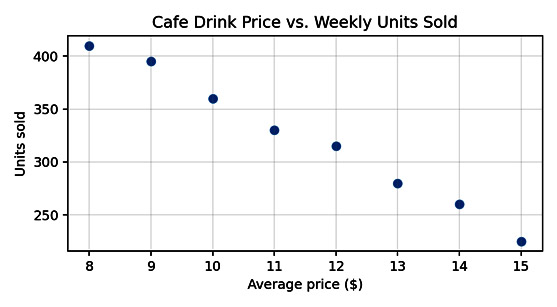
Complete the statements using the most accurate choices.
Answer: A) Negative; B) 100 units
Explanation:
As price increases, units sold generally decreases, so the relationship is negative. At $10, units sold are 360. At $14, units sold are 260. The decrease is 100 units.
Question 19 - Bar chart: contribution estimate
Refer to the chart of margin per unit and monthly volume.
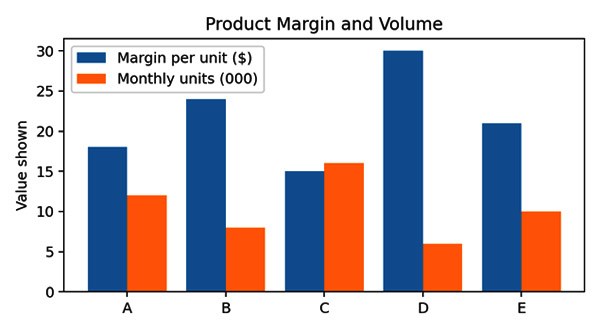
Complete the statements using the most accurate choices.
Answer: A) C; C) $6
Explanation:
Monthly contribution equals margin per unit times units sold. A: 18×12,000=216,000; B: 24×8,000=192,000; C: 15×16,000=240,000; D: 30×6,000=180,000; E: 21×10,000=210,000. Product C is greatest, not A. Product D margin exceeds B by 30−24=$6.
Question 20 - Histogram: delivery time
Refer to the histogram of delivery times for 60 orders.
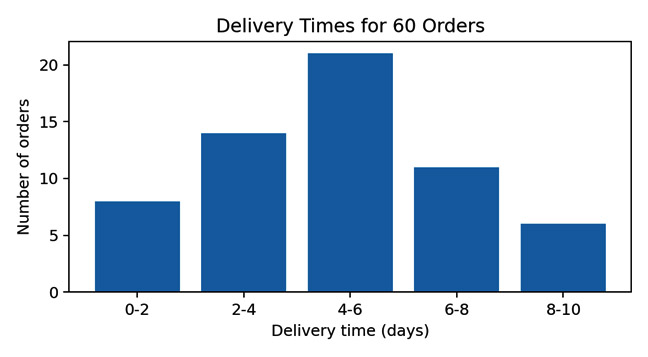
Complete the statements using the most accurate choices.
Answer: A) 4-6 days; B) 72%
Explanation:
The tallest bar is the 4-6 day interval with 21 orders, so it is the modal interval. Less than 6 days includes 0-2, 2-4, and 4-6: 8+14+21=43 orders. 43⁄60 = 71.7%, approximately 72%.
Question 21 - Stacked bar: channel mix
Refer to the stacked bar chart of sales channel mix by region.
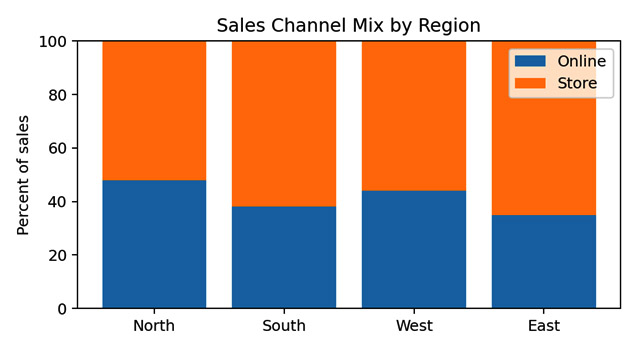
Complete the statements using the most accurate choices.
Answer: A) North; B) 3
Explanation:
Online shares are North 48%, South 38%, West 44%, and East 35%. North is highest. The difference between East and South is 38 - 35 = 3 percentage points.
Question 22 - Indexed revenue table
A company indexed revenue to 100 in Year 1. Year 2 index = 115, Year 3 index = 138, Year 4 index = 131.
Complete the statements using the most accurate choices.
Answer: A) 38%; B) decreased by 5.1%
Explanation:
An index of 138 means revenue is 38% higher than the Year 1 base. From Year 3 to Year 4, the change is (131−138)⁄138 = −7⁄138 = about −5.1%, so revenue decreased by about 5.1%.
Question 23 - Break-even chart in words
A vendor has fixed costs of $12,000, price per unit of $50, and variable cost per unit of $30.
Complete the statements using the most accurate choices.
Answer: A) 600 units; B) $6,000
Explanation:
Contribution per unit is price minus variable cost = 50 − 30 = 20. Break-even units = fixed cost ⁄ contribution per unit = 12,000⁄20 = 600. At 900 units, profit = 900×20 − 12,000 = 18,000 − 12,000 = 6,000.
Question 24 - Pie-style market shares from data
A market has four brands with shares: A 32%, B 28%, C 25%, and D 15%. Total market sales are $80 million.
Complete the statements using the most accurate choices.
Answer: A) $20 million; B) 35
Explanation:
Brand C sales are 25% of 80 million = 20 million. A+B = 32%+28%=60%; 60%-25%=35 percentage points.
Two-Part Analysis
Question 25. Simultaneous equations
A store sold notebooks and pens. Notebooks cost $4 each and pens cost $1.50 each. A customer bought 20 items for $50. Select the number of notebooks and the number of pens.
Select one answer in each column.
| Option | Notebooks | Pens |
|---|---|---|
| 8 | ||
| 9 | ||
| 10 | ||
| 11 | ||
| 12 |
Answer: 8 notebooks; 12 pens
Explanation:
Let n be notebooks and p be pens. The total-item equation is n + p = 20. The total-cost equation is 4n + 1.50p = 50. Substitute p = 20 − n: 4n + 1.50(20 − n) = 50, so 4n + 30 − 1.5n = 50, 2.5n = 20, and n = 8. Therefore p = 12.
Question 26. Discount and tax
An item is discounted by 25% and then taxed at 8%. The final price is $81. Select the list price and the tax amount.
Select one answer in each column.
| Option | List Price | Tax Amount |
|---|---|---|
| $90 | ||
| $96 | ||
| $100 | ||
| $108 | ||
| $120 | ||
| $6 |
Answer: List price = $100; Tax Amount = $6
Explanation:
After a 25% discount, the customer pays 75% of list price before tax. Tax is 8% of the discounted price, so final price = list price × 0.75 × 1.08 = list price × 0.81. If final is 81, list price is 100. Discounted price is 75, so tax is 0.08×75=6.
Question 27. Mixture
How many liters of 20% acid solution and 50% acid solution should be mixed to make 30 liters of 38% acid solution?
Select one answer in each column.
| Option | 20% Solution | 50% Solution |
|---|---|---|
| 10 | ||
| 12 | ||
| 15 | ||
| 18 | ||
| 20 |
Answer: 12 liters; 18 liters
Explanation:
Let x be liters of 20% solution and y be liters of 50% solution. x+y=30. Acid equation: .20x+.50y=.38(30)=11.4. Substitute x=30−y: 6−.20y+.50y=11.4, so .30y=5.4 and y=18; x=12.
Question 28. Rate trade-off
A consultant can complete a report in 6 hours and an analyst can complete it in 10 hours. If they work together for some time and then the consultant works alone for 2 hours, the report is completed. Select the total hours the analyst worked and total hours the consultant worked.
Select one answer in each column.
| Option | Analyst Hours | Consultant Hours |
|---|---|---|
| 2 | ||
| 2.5 | ||
| 3 | ||
| 4 | ||
| 4.5 |
Answer: 2.5 hours; 4.5 hours
Explanation:
Let t be the time they work together. Analyst works t hours; consultant works t+2 hours. Work completed: t⁄10 + (t+2)⁄6 = 1. Multiply by 30: 3t + 5t + 10 = 30, so 8t=20 and t=2.5. Then analyst 2.5 and consultant 4.5. Correct pair: 2.5; 4.5, which requires 4.5 as option.
Question 29. Profit target
A retailer sells a product for $75. Variable cost is $45, and fixed cost is $18,000. Select the units that break even and the units needed for $12,000 profit.
Select one answer in each column.
| Option | Break-even Units | Units for $12,000 Profit |
|---|---|---|
| 400 | ||
| 500 | ||
| 600 | ||
| 800 | ||
| 1,000 |
Answer: 600; 1,000
Explanation:
Contribution per unit = 75−45=30. Break-even units = 18,000⁄30=600. For $12,000 profit, contribution must cover fixed cost plus target profit: 18,000+12,000=30,000. 30,000⁄30=1,000.
Question 30. Mean and total
The average of x, y, and z is 18. The average of x and y is 15. Select z and x+y.
Select one answer in each column.
| Option | z | x + y |
|---|---|---|
| 30 | ||
| 36 | ||
| 42 | ||
| 45 | ||
| 54 | ||
| 24 |
Answer: 24; 30
Explanation:
Total x+y+z = 3×18 = 54. Since the average of x and y is 15, x+y = 30. Therefore z = 54−30 = 24. Correct pair: z=24 and x+y=30.
Question 31. Probability with replacement
A bag contains 3 green, 2 yellow, and 5 black tokens. One token is drawn, replaced, and another token is drawn. Select the probability that both tokens are green and the probability that at least one is black.
Select one answer in each column.
| Option | Both Green | At Least One Black |
|---|---|---|
| 3⁄10 | ||
| 9⁄100 | ||
| 1⁄4 | ||
| 1⁄2 | ||
| 3⁄4 |
Answer: 9⁄100; 3⁄4
Explanation:
Because the token is replaced, draws are independent. P(both green)=(3⁄10)(3⁄10)=9⁄100. P(at least one black)=1-P(no black). No black means green or yellow, probability 5⁄10 each draw, so no black=(1⁄2)²=1⁄4. Therefore at least one black=3⁄4.
Question 32. Inequality interval
For which values of x is 3x − 5 < 16 and 2x + 1 ≥ 9? Select the lower bound and upper bound of the solution interval.
Select one answer in each column.
| Option | Lower Bound Included | Upper Bound Not Included |
|---|---|---|
| 2 | ||
| 4 | ||
| 5 | ||
| 7 | ||
| 9 |
Answer: 4; 7
Explanation:
Solve each inequality. 3x−5<16 gives 3x<21, so x<7. 2x+1≥9 gives 2x≥8, so x≥4. Together, 4 ≤ x < 7. Lower bound included is 4; upper bound not included is 7.
Multi-Source Reasoning
Question 33 - Expansion decision
Which region satisfies both expansion criteria?
Source 1 - Manager memo: A retailer will expand only if a region has projected revenue of at least $2.0 million and payback period below 3 years.
Source 2 - Finance table: Region North: investment $900k, annual cash flow $360k, projected revenue $2.4m. Region South: investment $750k, annual cash flow $250k, projected revenue $2.1m. Region West: investment $1.2m, annual cash flow $500k, projected revenue $1.9m.
Answer: A
Explanation:
Payback = investment ⁄ annual cash flow. North: 900⁄360 = 2.5 years and revenue 2.4m, so it qualifies. South: 750⁄250 = 3.0 years, not below 3, so it fails. West: 1200⁄500 = 2.4 years but revenue is only 1.9m, so it fails.
Question 34 - Supplier selection
Which supplier is acceptable?
Source 1 - Policy: A supplier is acceptable if defect rate is below 2.5%, on-time rate is at least 94%, and unit cost is no more than $18.
Source 2 - Supplier data: A: defect 2.1%, on-time 95%, cost $19. B: defect 2.4%, on-time 94%, cost $18. C: defect 1.8%, on-time 92%, cost $17. D: defect 2.6%, on-time 97%, cost $16.
Answer: B
Explanation:
Supplier B meets all three conditions exactly or better: defect 2.4% below 2.5%, on-time 94% at least 94%, cost 18 no more than 18. A fails cost, C fails on-time rate, and D fails defect rate.
Question 35 - Campaign ROI
Which campaign or campaigns were successful?
Source 1 - Formula: ROI = (incremental profit − campaign cost) ⁄ campaign cost. A campaign is successful if ROI is at least 25%.
Source 2 - Data: Email: incremental profit $45k, cost $30k. Search: profit $70k, cost $60k. Social: profit $55k, cost $40k.
Answer: C
Explanation:
Email ROI=(45−30)/30=50%. Search ROI=(70−60)/60=16.7%. Social ROI=(55−40)/40=37.5%. Email and Social meet or exceed 25%; Search does not.
Question 36 - Hiring plan
How many additional analysts should be hired for next quarter?
Source 1 - Staffing rule: A team must add one analyst for every additional 120 client accounts beyond 600 accounts. Round up partial requirements.
Source 2 - Forecast: Current accounts: 610. Forecast accounts next quarter: 925. Current analysts: 3.
Answer: C
Explanation:
Additional accounts beyond 600 next quarter = 925 − 600 = 325. One analyst is needed for every 120 accounts, and partial requirements are rounded up: 325⁄120 = 2.71, so 3 analysts are required. The question asks how many additional analysts should be hired; since the rule is about analysts needed beyond 600, the answer is 3.
Question 37 - Capacity and bottleneck
What is the maximum number of units the plant can produce per day?
Source 1 - Production notes: Each unit requires 4 minutes on Machine X and 6 minutes on Machine Y. The plant operates 8 hours per day.
Source 2 - Availability: Machine X has 2 machines available. Machine Y has 3 machines available. Demand is 250 units per day.
Answer: B
Explanation:
Daily minutes available: Machine X has 2×8×60=960 minutes, so capacity is 960⁄4=240 units. Machine Y has 3×8×60=1440 minutes, so capacity is 1440⁄6=240 units. The plant maximum is the smaller bottleneck capacity: 240 units.
Question 38 - Customer lifetime value
Which segment has the greatest lifetime value?
Source 1 - Model: Lifetime value = monthly gross profit × expected months retained − acquisition cost.
Source 2 - Segment data: Segment Small: monthly profit $35, retained 18 months, acquisition cost $220. Segment Mid: monthly profit $60, retained 14 months, acquisition cost $360. Segment Enterprise: monthly profit $140, retained 8 months, acquisition cost $650.
Answer: B
Explanation:
Small LTV = 35×18 − 220 = 410. Mid LTV = 60×14 − 360 = 480. Enterprise LTV = 140×8 − 650 = 470. Mid is greatest.
Question 39 - Pricing experiment
Was the price increase successful?
Source 1 - Test design: A price increase is considered successful if total revenue rises and unit sales fall by no more than 10%.
Source 2 - Results: Old price $20, old units 5,000. New price $23, new units 4,600.
Answer: A
Explanation:
Old revenue = 20×5000 = 100,000. New revenue = 23×4600 = 105,800, so revenue rose. Unit loss = 400 units on a base of 5,000, or 8%, which is no more than 10%. Both criteria are met.
Question 40 - Data discrepancy
Which conclusion is best supported?
Source 1 - Operations report: The company shipped 12,000 orders in May, and 96% were delivered on time.
Source 2 - Customer service report: In May, customers filed 620 late-delivery complaints. Each late order can generate at most one late-delivery complaint.
Answer: B
Explanation:
If 96% were on time, then 4% were late. 4% of 12,000 is 480 late orders. Since each late order can generate at most one late-delivery complaint, complaints cannot exceed late orders. But the customer service report shows 620 complaints. Therefore the reports cannot both be accurate.